
Published October 15, 2026
Why We Don’t Diversify: The Case for Concentration
At Worldly, we follow a high-conviction investment approach, concentrating meaningful capital in a small handful of well-researched ideas.
Through our ongoing study of history’s highest-returning companies, we have isolated the few business models that we believe are both durable enough to support above-average earnings growth for decades and knowable enough to allow us to underwrite this earnings potential on a prospective basis.
By owning what we would consider to be just a few such competitively advantaged businesses at reasonable entry prices, we seek to compound our partners’ capital over very long periods at rates exceeding the market average. This type of concentration has, in some cases, led to remarkable wealth outcomes throughout history, and we also believe it provides greater long-term protection against investment mistakes than is commonly understood.
Concentration Built History’s Greatest Fortunes, Not Diversification
“If you look at how the fortunes were built in this country, they weren’t built out of a portfolio of 50 companies. They were built by someone who identified a wonderful business.” 1
– Warren Buffett
To Buffett’s point, the returns of a typical diversified portfolio just don’t support the type of growth we observe among business history’s greatest fortunes.
The S&P 500 index, for instance, has compounded at an annualized rate of approximately 10% (with dividends reinvested) from the end of 1995 to the end of 2025.2 At this rate of return, we would need over $50 million in initial capital, already a decent-sized fortune, if we wanted to reach a milestone of $1 billion within 30 years by investing in an S&P 500 index fund.
On the other hand, by taking more concentrated positions and thus diverging from the market index, we create an opportunity for (though not a guarantee of) above-market returns. This, in turn, may give us the opportunity to achieve much greater wealth from our starting capital. In fact, many of the wealthiest individuals and families today built their immense fortunes from extremely concentrated positions. Here are a few notable examples:
- Sam Walton and his family – through their holding entity, Walton Enterprises – owned 61% of outstanding Walmart shares when the company went public in 1970, a stake worth $15.2 million at the offering price.3 Had they sold their position and diversified the proceeds in an S&P 500 index fund, it would currently be worth $6.1 billion.4 Instead, the family remained concentrated, with Walton Enterprises continuing to exercise voting power over roughly 44% of Walmart’s outstanding shares.5 Today, the stake in Walmart owned by Sam Walton’s side of the family is worth an estimated $359 billion. This represents nearly four-fifths of the family’s overall net worth6 and is nearly 59x the hypothetical wealth they would have created by diversifying in the S&P 500.
- Larry Page and Sergey Brin each beneficially owned around 14% of outstanding Google shares following the company’s 2004 IPO, stakes worth around $3.2 billion apiece based on the company’s offering price.7 Had they both sold all their shares and invested the proceeds in an S&P 500 index fund, each of these positions would today be worth around $33 billion.8 Page and Brin have indeed sold and gifted substantial amounts of stock since the IPO,9 reducing their economic ownership of Alphabet to approximately 6.4% and 5.9% respectively.10 Still, even these reduced stakes are worth substantially more than the wealth they would have created by fully diversifying. Today, a 6.4% and 5.9% stake in Alphabet are worth around $259 billion and $239 billion respectively.11 These positions represent around 90% of the pair’s combined net worth12 and are worth 7-8x the hypothetical wealth Page and Brin would have created by diversifying in the S&P 500 at the time of Google’s IPO. Read our multi-decade Alphabet study.
- Ken Langone held a stake in Home Depot that we estimate was worth around $581,000 at the time of the company’s IPO in 1981.13 Had he liquidated this position at IPO and diversified the proceeds in an S&P 500 index fund, it would today be worth $109 million, assuming dividends were reinvested.14 Instead, he remained concentrated in Home Depot and, in fact, according to his own public statements, has never sold a share, apart from those he has donated to charity.15 Today, Langone’s concentrated Home Depot position is around $5 billion, and that’s assuming dividends weren’t reinvested.16 This figure accounts for roughly 50% of Langone’s 2026 net worth as reported by Forbes17 and is 45x the hypothetical wealth Langone would have created by diversifying in the S&P 500 at the time of Home Depot’s IPO. Watch our interview with Ken Langone.
“As a family we’ve only sold very limited amounts of Wal-Mart stock… I think that has really set us apart, and, as I said, that’s the source of our net worth. We just kept that stock.” 18
– Sam Walton
These stories, of course, represent the best possible ex post outcomes from concentrated ownership. Walmart, Alphabet, and Home Depot are some of the highest-returning companies in history, delivering annualized returns of 23%, 25%, and 24% respectively from their IPOs to the present year.19
Businesses that compound at such levels for such long periods are rare indeed, and, as a matter of pure probabilities, the chance of finding such a business in the haystack of the public market is admittedly quite low. Though we believe that our knowledge of business history gives us an edge in the search for competitively advantaged businesses, we still believe it’s prudent to examine more realistic examples of concentration, where returns are lower, as well as downside scenarios, in case our concentrated investments don’t quite work out as expected.
Here we follow Charlie’s famous advice to “Invert, always invert”20 – to consider not just how to succeed but also how to fail. As it so happens – and as Charlie himself argued – we think that intelligent concentration provides plenty of protection against failure.
How Risky Is Concentration? Charlie's Three-Stock Example
“If you are going to operate for 30 years and only own 3 securities but you had an expectancy of outperforming averages of say 4 points a year or something like that on each of those 3 securities, how much of a chance are you taking when you get a wildly worse result on the average? I’d work that out mathematically and assuming you’d stay for 30 years you’d have a more volatile record but the long‐term expectancy was – in terms of disaster prevention – plenty good enough for 3 securities.”21
– Charlie Munger
In today’s market, where actively managed U.S. equity funds held an average of 160 securities as of 2023,22 Charlie’s three-stock scenario may seem like an almost absurd example of concentration risk.
And yet, if risk is defined as the probability of the long-term underperformance of a benchmark – say, the rest of the equity market with its annualized return of 10% over the past century23 – then we believe that Charlie’s three-stock portfolio is surprisingly robust, provided the chosen businesses are well-researched and have a reasonable chance of generating above-market returns. To illustrate this point, let’s explore a few possible outcomes of Charlie’s high-conviction investing strategy.
On the upside, all three businesses could grow as expected, outperforming the market by four points a year. This scenario is more conservative than the Walmart, Alphabet, and Home Depot examples, since the annualized returns of these companies exceed the market average by 13 percentage points or more. Still, the 14% annual return proposed by Charlie results in some impressive wealth outcomes. Compounded across 30 years – Charlie’s stated horizon – a 14% annual return would multiply our initial capital by 51x. The market benchmark, by contrast, compounding at its historical annualized rate of 10%, would deliver a 17x after 30 years.
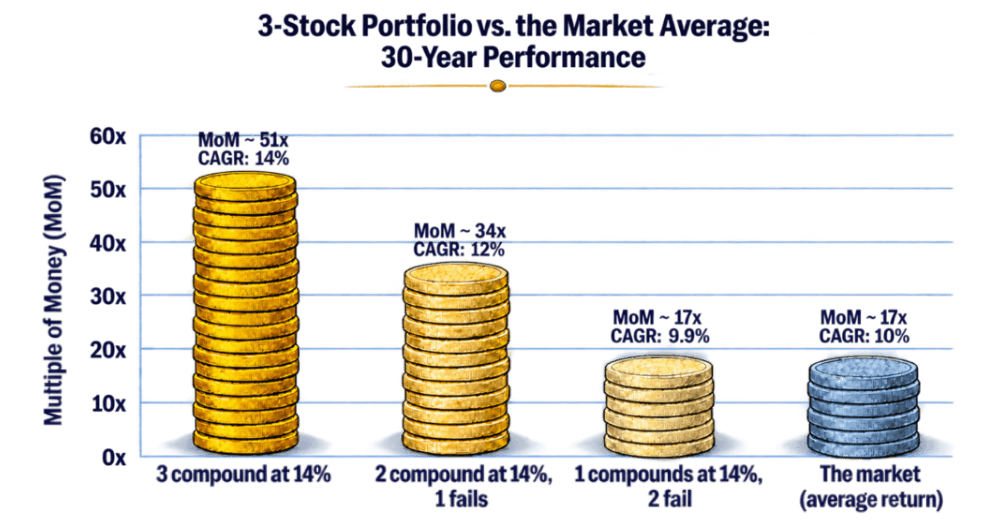
But that’s just the upside scenario. Now let’s explore the risks: what would happen if one of our three businesses failed completely, resulting in the permanent loss of one-third of our initial capital? This would no doubt be psychologically uncomfortable, but over 30 years, assuming our three positions were equally weighted at the start and held without rebalancing, our portfolio would still grow at a roughly 12% annualized rate, leaving us with 34x our initial wealth – still comfortably above the market’s historical returns.
What would it take to underperform the market benchmark over 30 years? We’d need to assume that two out of our three companies will fail, resulting in the permanent impairment of two-thirds of our starting capital. This strikes us as a very aggressive assumption given the focus and attention we bring to evaluating candidate investments, the fundamentally knowable business models our companies are grounded in, and the ongoing monitoring program we use to track our holdings.
Still, even if we assume that two out of our three stocks go to zero, if our third company compounds at 14% as expected, our portfolio will still grow at a 9.9% annualized rate, leaving us with 17x our initial wealth over 30 years. That’s only a 10-basis-point underperformance versus the rest of the market – far from a disaster.
In other words, we could be completely wrong about two out of three companies and still essentially match the market benchmark over 30 years, just by being right about one stock that compounds at 4 points above average!
Further, if this one stock continues compounding at 14%, it will end up exceeding the historical returns of the market by Year 31, just one year later. By Year 40, this single winner will have multiplied our capital by 63x, comfortably above the 45x produced by the market. And, again, that’s assuming that our two other companies wind up in the graveyard.
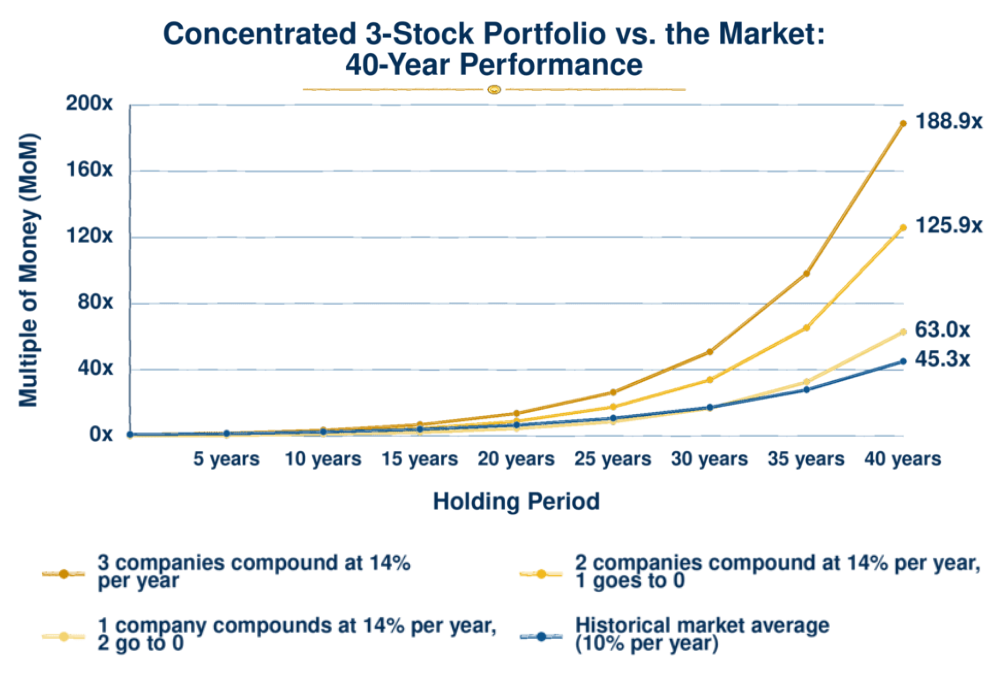
We think it’s notable that a portfolio of just three concentrated positions with reasonable odds of above-market compounding can withstand up to two disastrous mistakes and still approximate market returns after 30 years and exceed them thereafter. This, we believe, is what Charlie meant when he said that “the long-term expectancy was – in terms of disaster prevention – plenty good enough for three securities.”
Meanwhile, if all three, or even just two, of the businesses perform as expected, the portfolio has potential upside that we believe diversification is unlikely to provide.
Concentration for Institutional Investors: Rewards vs. Risk
At the equity-portfolio level, we believe the case for concentration is clear. But what about from an allocator’s perspective?
Admittedly, Charlie’s three-stock example might not seem (on the surface) applicable to endowments, foundations, and family offices whose portfolios span different asset classes and strategies and where long-term returns are balanced against other objectives like stable distributions, limited volatility, liquidity needs, etc.
And yet, in our view, even these broadly diversified portfolios can benefit from the logic of concentration that Charlie put forth.
Consider, for instance, an allocator’s portfolio diversified across asset classes and strategies, generating an annualized return of 7.3% net of fees, exactly the average among U.S. higher-education endowments over the past 20 years.24 Compounded over 30 years (and assuming no distributions), a 7.3% annual return would multiply the portfolio’s starting capital by 8.3x.
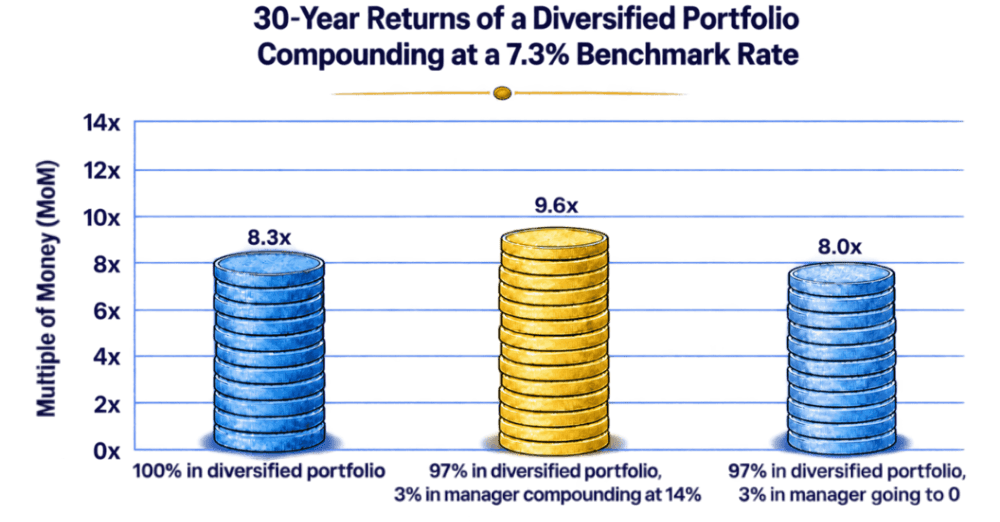
Now consider what would happen if the allocator invested just 3% of assets in an equity manager aiming for a 14% annual return (the same as Charlie’s 3-stock portfolio) net of fees, through the concentrated ownership of a handful of competitively advantaged businesses.
If all goes to plan – with 3% of the portfolio compounding at 14% and 97% compounding at 7.3% – the portfolio would deliver a 9.6x after 30 years,25 roughly 15% more than the peer group’s average of 8.3x over the same period.
The worst-case scenario, on the other hand, is that the concentrated equity manager suffers a total loss, permanently impairing 3% of the allocator’s initial capital. Yet even in this downside case, the result is hardly a disaster for the allocator, whose remaining 97% of assets would still compound at 7.3%, delivering an 8.0x over 30 years, only a 3% underperformance of the reference case.
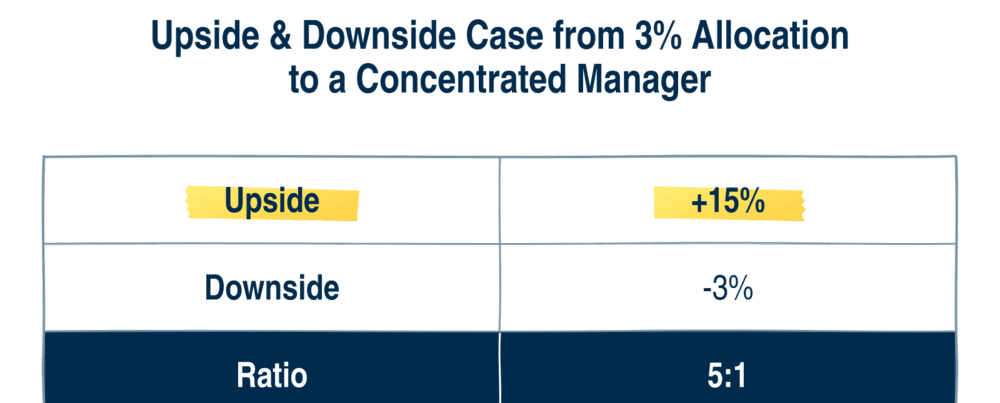
In other words, the possible upside of this limited concentrated investment is around 15%, while the possible downside is only 3%, a 5:1 asymmetry.
The Next Walmart, Alphabet, or Home Depot
At Worldly, we believe that our studies of the most successful companies in history, our distillation of the business models that we think are most knowable and durable, and our constant filtering of the public markets increase our odds of finding a great compounder – the next Walmart, Alphabet, or Home Depot of business history.
Motivating this search, of course, is the possibility of extraordinary returns – on par with those achieved by the Walton family, Larry Page and Sergey Brin, and Ken Langone – though we are also reassured, as shown by Charlie’s 3-stock example, that we don’t need a perfect record to beat the market.
Sources and Notes
- Warren Buffett speaking at the 1996 Berkshire Hathaway annual meeting. ↩
- The “Historical Returns on Stocks, Bonds, and Bills” data set maintained by NYU Stern Professor of Finance Aswath Damodaran shows that from 1995 to 2025, the annualized return of the S&P 500 index was around 10.3%. ↩
- The SEC’s April 7, 1970, News Digest, summarizing Walmart’s initial registration statement, reported that the company had 1,300,000 shares outstanding and planned to issue 206,000 new shares in the offering. It also reported that Walton Enterprises owned 1,000,578 shares and planned to sell 80,000 of them. Walton Enterprises therefore retained 920,578 (approximately 61.13%) of the 1,506,000 outstanding shares following the offering. At Walmart’s final offering price of $16.50 per share, the position was worth approximately $15.19 million. ↩
- This calculation is based on the S&P 500’s estimated total return from October 1970 through July 2026, with dividends reinvested, using the average closing prices for these months as start and end points. It assumes the family could have replicated the returns of the S&P 500 before the first retail index fund was launched by Vanguard in 1976. ↩
- Walmart’s Amendment No. 1 to Schedule 13D, filed March 3, 2026, reports that Walton Enterprises, LLC beneficially owned 3,523,409,231 shares, representing 44.21% of Walmart’s outstanding common stock. This figure consists of 3,002,673,393 shares held directly by Walton Enterprises and 520,735,838 shares held by the Walton Family Holdings Trust, over which Walton Enterprises exercises sole voting power. Accordingly, 44.21% describes beneficial ownership and voting power under SEC reporting rules. ↩
- Forbes estimates that “Sam Walton’s three living children–Rob Walton, Jim Walton and Alice Walton–and their families, as well their brother John Walton’s (d. 2005) widow Christy Walton and only child Lukas Walton” are collectively worth $463 billion, of which $359 billion (roughly four-fifths) is derived from their continued stake in Walmart. According to Forbes, this net worth estimate excludes the approximately 6% of Walmart shares, worth $51.3 billion, that is owned by the family’s charitable trusts. ↩
- Google’s final IPO prospectus reported that, after the offering, Larry Page beneficially owned 38,110,785 shares and Sergey Brin owned 38,007,935 shares. Google had 271,219,643 total shares outstanding following the offering, making Page’s economic ownership approximately 14.05% and Brin’s approximately 14.01%. Multiplying their holdings by the $85 offering price produces values of approximately $3.24 billion and $3.23 billion. ↩
- This calculation is based on the S&P 500’s estimated total return, with dividends reinvested, from August 2004 through July 2026, using the average closing prices for these months as start and end points. ↩
- Forbes reported that Page and Brin collectively sold approximately $448 million of Alphabet stock in May–June 2021, based on SEC filings. It also notes that both had previously sold shares through 2017. Brin’s August 2026 Form 4 records gifts – transaction code “G” – of 673,200 Class A and 673,200 Class C shares. Brin also transferred more than four million shares worth approximately $693 million in May 2025, according to an SEC filing described by Business Insider. ↩
- Alphabet’s July 2026 quarterly filing reported approximately 12.23 billion Class A, Class B and Class C shares outstanding as of July 15, 2026. Alphabet’s 2026 proxy reported 389.1 million Class B shares for Larry Page and 358.9 million for Sergey Brin as of April 6, 2026. Separately, in an April 2022 Form 4 filing, Page reported owning 19.5 million nonvoting Class C shares, equivalent to 390 million Class C shares today, adjusted for Alphabet’s subsequent 20-for-1 stock split. Meanwhile, Brin’s February 2026 Form 4 reported approximately 360.2 million Class C shares. These figures imply a 6.4% stake for Page ([389.1 million Class B shares + 390 million Class C shares] / 12.23 billion shares outstanding) and 5.9% stake for Brin ([358.9 million Class B shares + 360.2 million Class C shares] / 12.23 billion shares outstanding). ↩
- As mentioned above, Larry Page is estimated to own 389.1 million Class B shares and 390 million Class C shares. Valuing both these positions at Alphabet’s Class C closing price of $332.60 as of July 28, 2026 implies that Page’s stake in the company is worth around $259 billion. Sergey Brin, meanwhile, is estimated to own 358.9 million Class B shares and 360.2 million Class C shares, also discussed above. This position is worth $239 billion valued at Alphabet’s Class C closing price of $332.60 on July 28, 2026. ↩
- As of July 28, 2026, Bloomberg’s net-worth estimates were $287 billion for Page and $266 billion for Brin, which would imply that around 90% of each founder’s wealth comes from their Alphabet positions. ↩
- According to Home Depot’s 2008 proxy statement, Ken Langone beneficially owned 16,533,055 shares of Home Depot, around 1% of the company’s 1,690,034,627 outstanding shares. From its IPO date in 1981 to 2008, Home Depot split its stock 13 times, producing a cumulative split factor of 341.7 to 1. That means that the 16,533,055 shares Ken owned in 2008 would have totaled 48,382 shares at IPO, assuming he didn’t dispose of any shares in the interim. (In fact, his position at IPO was probably larger because he made several donations of Home Depot stock over the years.) 48,382 shares at IPO, valued at Home Depot’s offering price of $12 per share, would have been worth around $580,585. ↩
- According to data sourced from Global Financial Data (Finaeon), $581,000 invested in the S&P 500 at the date of Home Depot’s IPO in September 1981 would have grown to $109 million by the end of July 2026, assuming dividends were reinvested.↩
- In an interview with the Palm Beach Civic Association, Langone reportedly said that “he has never sold any of his Home Depot shares in the 48-year history of the company, though he has donated some to charity.” In SEC filings, Langone reported gifts totaling 500,000 shares each in 2003, 2004, and 2006. ↩
- As mentioned in a previous footnote, Langone owned 16,533,055 shares of Home Depot by 2008, according to a proxy statement from that same year. Because Home Depot has not split its stock since 1999, Langone would still own exactly as many shares today as he did in 2008, assuming he hasn’t donated any stock. As of September 17, 2026, Home Depot was trading at $305 per share. Langone’s 16,533,055 shares would therefore be worth around $5 billion today.↩
- Forbes reports Langone’s net worth at around $10.3 billion as of 2026. ↩
- Sam Walton, Made in America, 1992. ↩
- Walmart, Alphabet, and Home Depot return data was sourced from FactSet. According to this data, Walmart delivered an annualized return of around 23% from the date of the company’s IPO on October 1, 1970 to August 31, 2026, Alphabet delivered an annualized return of around 25% from Google’s IPO on August 19, 2004 to August 31, 2026, and Home Depot delivered an annualized return of around 24% from September 22, 1981 to July 31, 2026. Annualized returns for all three companies were calculated assuming dividends were reinvested. ↩
- Charlie attributes this phrase to the 19th-century mathematician Carl Jacobi, who proved theorems by showing why their opposite was contradictory. See “Talk Four: Practical Thought about Practical Thought?” in Poor Charlie’s Almanack, p. 165. ↩
- Charlie Munger, quoted by Allen C. Benello, Michael van Biema, and Tobias E. Carlisle in Concentrated Investing: Strategies of the World’s Greatest Concentrated Value Investors on p. 121–22. ↩
- Jason Zweig, in a Wall Street Journal article published April 14, 2023, wrote: “Total-market index funds consist of about 4,000 stocks, but fund managers have to be choosier than that to justify their fees. On average, actively managed U.S. funds hold 160 stocks, according to Morningstar.” ↩
- The “Historical Returns on Stocks, Bonds, and Bills” data set maintained by NYU Stern Professor of Finance Aswath Damodaran shows that $100 invested in the S&P 500 at the beginning of 1928, with dividends reinvested, would have grown to $1,157,598.95 by the end of 2025 – equivalent to a compound annual growth rate of around 10.02%. Since the S&P 500 index wasn’t launched until 1957, Damodaran uses predecessor large-cap U.S. stock indices to re-create return data for previous years.↩
- According to the 2025 NACUBO-Commonfund Study of Endowments, which covers over 650 institutions, U.S. college and university endowments generated an average annualized return of 7.3% net of fees over the 20 years ending June 30, 2025.↩
- This ending wealth multiple (9.6x after 30 years) assumes that the initial 3% allocation and the remaining 97% of the initial portfolio are allowed to appreciate at an annual growth rate of 14% and 7.3% respectively without portfolio rebalancing. Thanks to its superior growth rate, the sleeve invested in the concentrated manager will account for around 16% of the portfolio’s total value by the end of the 30-year investment period versus 3% at the start of the period. ↩